
Using the JavaScript Developer Console
Login
Modern browsers have built-in development tools that make it easier to work with JavaScript and other web technologies.
These tools include the Console, which resembles a shell interface. It also includes functions such as inspecting the DOM, debugging, and analyzing network traffic.
The console can be used to log information during the JavaScript development process.
It also allows you to interact with the web page by running JavaScript expressions in the context of the page.
In summary, Console gives you a convenient way to write, manage and monitor JavaScript code whenever you need it.
In this guide, we will learn how to work with Console and JavaScript in the browser.
We will also give an overview of other built-in development tools that you can use in the web development process.
Note: While following this guide you may notice that your browser or Console looks different from the screenshots in the examples.
Browsers are updated frequently, new tools may be added or their visual designs may change.
These updates do not affect your ability to use the Console.
Working with Console in the Browser
Most modern browsers that support standards-based HTML and XHTML give you access to the Developer Console.
This console allows you to work with JavaScript in a terminal-like interface.
In this section we will look at how to access the Console in the Chrome browser.
Opening JavaScript Console in Chrome
To open JavaScript Console in Chrome, open the menu from the three vertical dots in the upper-right corner of your browser.
From here, follow More Tools > Developer Tools.
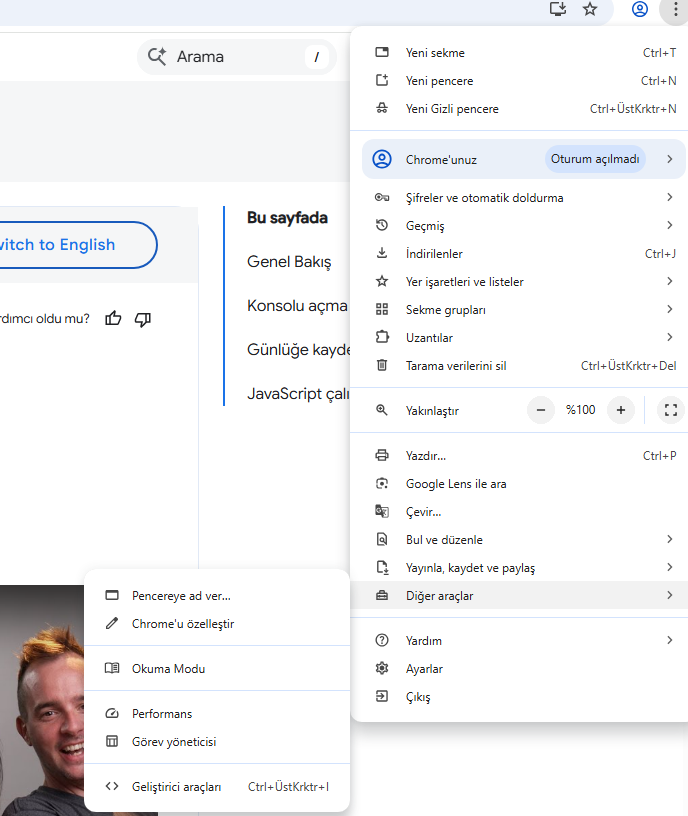
When you do these steps, a panel will open.
You can open the JavaScript Console by clicking the Console tab in the top menu bar.
If it is already selected, you can start using it directly.
You can also switch to JavaScript Console using a shortcut:
- Linux / Windows:
CTRL + SHIFT + J - macOS:
COMMAND + OPTION + J
These shortcuts focus you directly on the Console.
Now that you have access to the Console, you can start working with JavaScript.
Working in Console
You can write and run JavaScript code within the console.
For example, let's start with a simple alert that prints Welcome to GenixNode Docs..”:
alert("GenixNode Docs'a Hoşgeldiniz..")
When you press ENTER after typing your JavaScript line, an alert window will open in your browser:
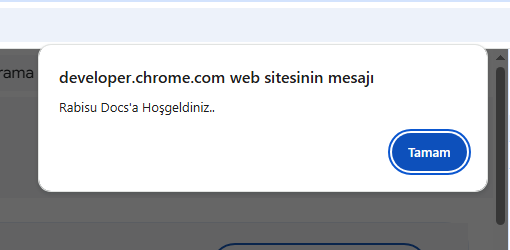
Note: The console will evaluate the expression you typed and display the result. If the expression does not explicitly return a value, the result appears as undefined.
Instead of pop-up alerts that you have to keep clicking on, you can use console.log to print JavaScript output to the Console.
For example, to print Welcome to GenixNode Docs.. in the Console, type the following line:
console.log("GenixNode Docs'a Hoşgeldiniz..")
You will see the following output in the console:
Output
GenixNode Docs'a Hoşgeldiniz..
You can also perform mathematical operations in the console:
console.log("4+9")
You will see the following output in the console:
Output
13
You can also try more complex mathematical operations:
console.log("435.63635463 * 342.5346")
Output
149220.5245
You can also operate on multiple lines by working with variables:
let today = new Date();
console.log("Bugünün tarihi: " + today);
Output
Bugünün Tarihi: Sun Sep 28 2025 15:53:09 GMT-0700 (Kuzey Amerika Pasifik Yaz Saati)
If you want to change a command you typed into the console, you can bring back the previous command by pressing the up arrow (↑) key on your keyboard.
So you can edit the command and run it again.
JavaScript Console gives you the ability to test JavaScript code in real time within a terminal-like interface.
Understanding Other Development Tools
Depending on the browser you use, different tools may be offered to help your development process.
Thanks to these tools, you can make your web development workflow more efficient.
DOM — Document Object Model
Each time a web page loads, the browser creates the Document Object Model (DOM) structure of that page.
DOM displays the HTML elements on the page hierarchically as a tree.
You can view this DOM Tree in the Elements panel in Chrome.
Thanks to these tools, you can examine and edit DOM elements.
It also helps you find the HTML code for a specific element on a page.
For example, the DOM can tell you whether a piece of text or an image has the ID property and, if so, the value of that property.
The page you edited above will look something like this in the DOM view before reloading:

You can also see CSS styles next to or below the DOM panel.
In this way, you have the chance to examine which styles are applied in the HTML document or an external CSS file.
For example, here's how you can see the styles used for your sample page's <body> tag in the Chrome Elements panel:
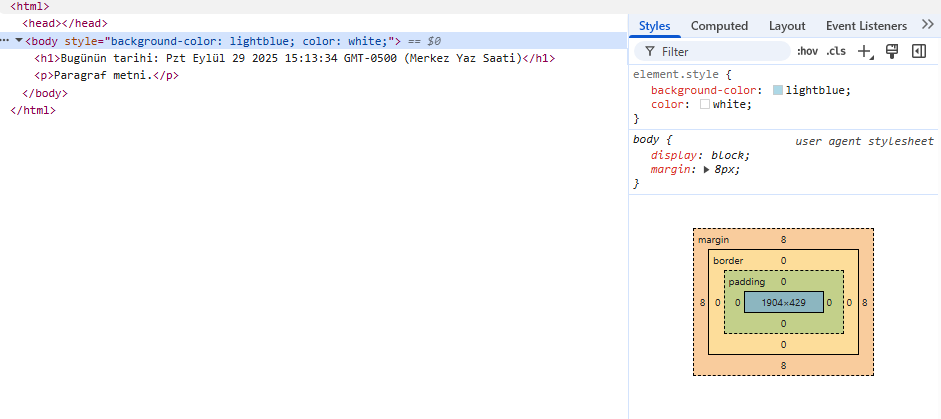
To edit a DOM element live, double-click the element of your choice and make changes.
For example, you can change a tag <h1> to become a tag <h2>.
Just like in Console, when you reload the page, the HTML document reverts to its original saved state.
Network
The Network tab in your browser's built-in development tools may monitor and record network requests made.
In this tab you can see what requests the browser makes:
- Requests made during page loading,
- How long each request takes,
- Details of requests.
This information can be used to optimize page loading performance and debug network requests.
You can also use it with JavaScript Console. So, you can start debugging in the Console first and then switch to the Network tab to see the network traffic without reloading the page.
To learn how to use the Network tab, you can take a look at the documentation Getting started analyzing network performance with Chrome DevTools.
Responsive Design
When a website is responsive, it looks and works correctly on different devices (phone, tablet, desktop, laptop).
When developing across devices; Factors such as screen size, pixel density and touch support should be taken into account.
As a web developer, it is important to observe responsive design principles. This way, your site is accessible no matter what device the user uses.
Chrome offers modes that allow you to test responsive design principles as you develop your sites.
Thanks to these modes, you can examine and analyze your site by imitating different devices.
More Information:
To learn responsive design testing tools, you can take a look at the Chrome Device Mode documentation.
Result
Congratulations, in this guide you have learned how to work with JavaScript Console in modern browsers.
We also briefly touched upon other tools that will be useful in your development process.